Visualizer
The Visualizer is both a diagnostic tool that can view recognized tangibles and their associated data, and a demo application that shows off some interesting and vibrant ways Tangible Engine can be used.
Launching the Visualizer
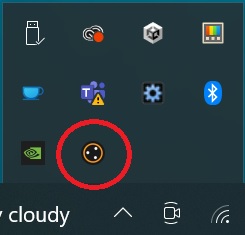
To launch the Visualizer, left-click on the TE v3 system tray icon in the Windows task bar.
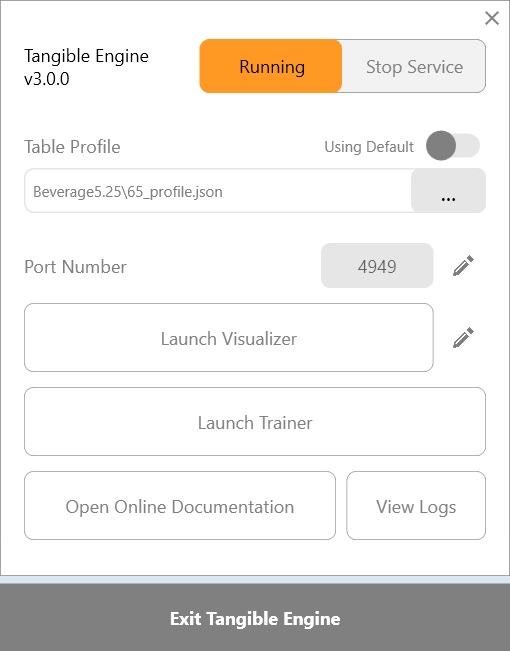
This will open up the Service Interface.
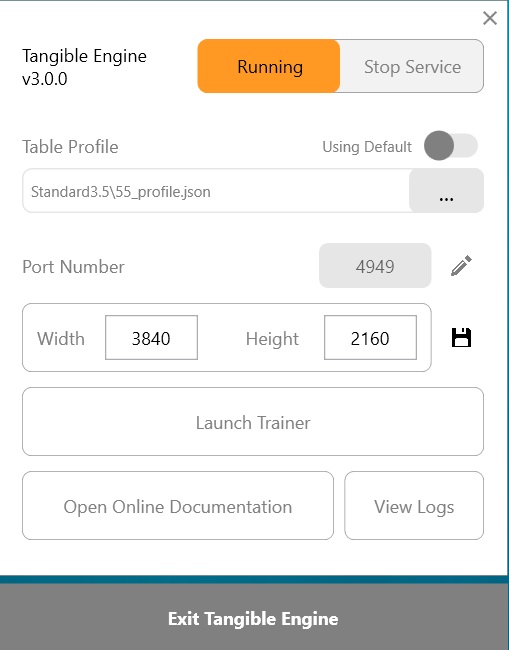
The option to change the resolution of the Visualizer has been added to force the application into the wanted size. The default resolution is 3840 x 2160. Click the save button when finished.
Click on the Launch Visualizer button and the application will run.
Diagnostic Mode
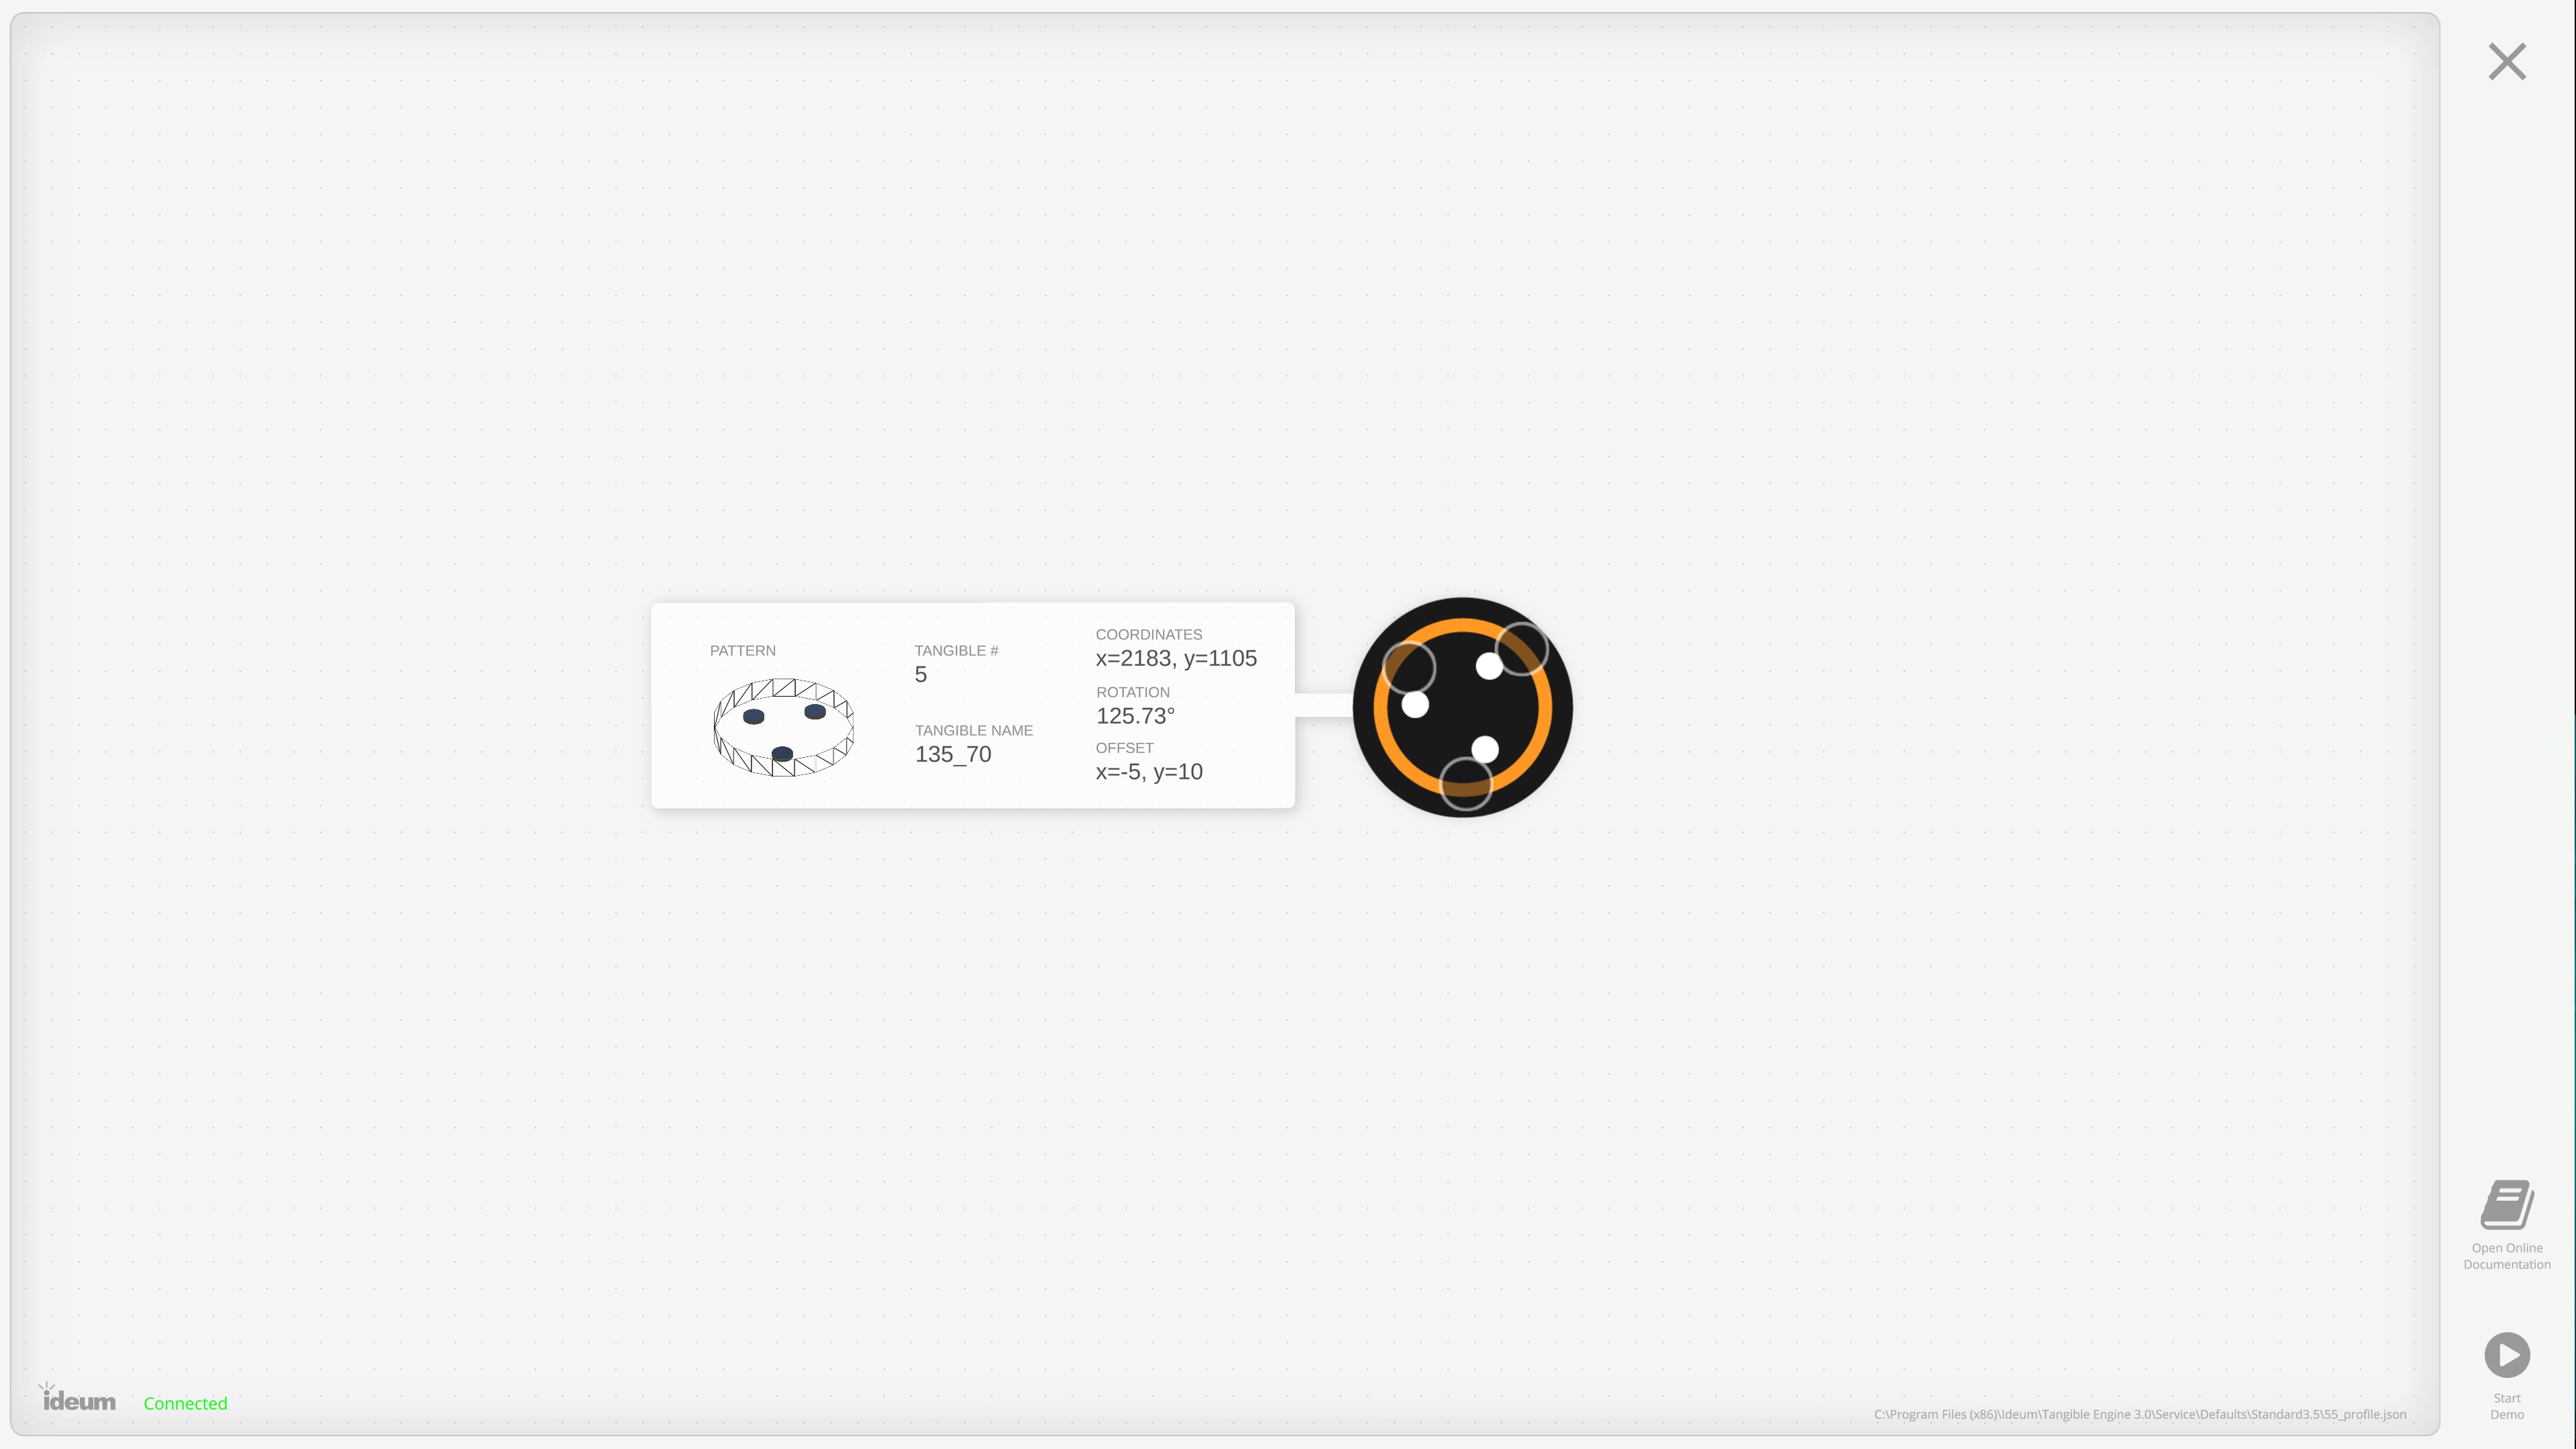
The Visualizer will open into the diagnostic menu by default, to allow for fast testing of tangibles. It also includes a button to quickly navigate to the online documentation.
Whenever a recognized tangible is placed on the table, a tangible visual will appear with all of the associated information in a dialog box such as the pattern ID, pattern name, x and y positions, rotation (in degrees), and x and y UI offsets from the center point (of the feet, not necessarily the tangible base).
If a tangible is placed on the table and nothing appears in the visualizer, it means that Tangible Engine was unable to find a matching pattern in the current tangible profile.
A connection status is now located in the lower left hand corner. Make sure this says "connected". If it says "failed to connect", check that Tangible Engine is running in the background.
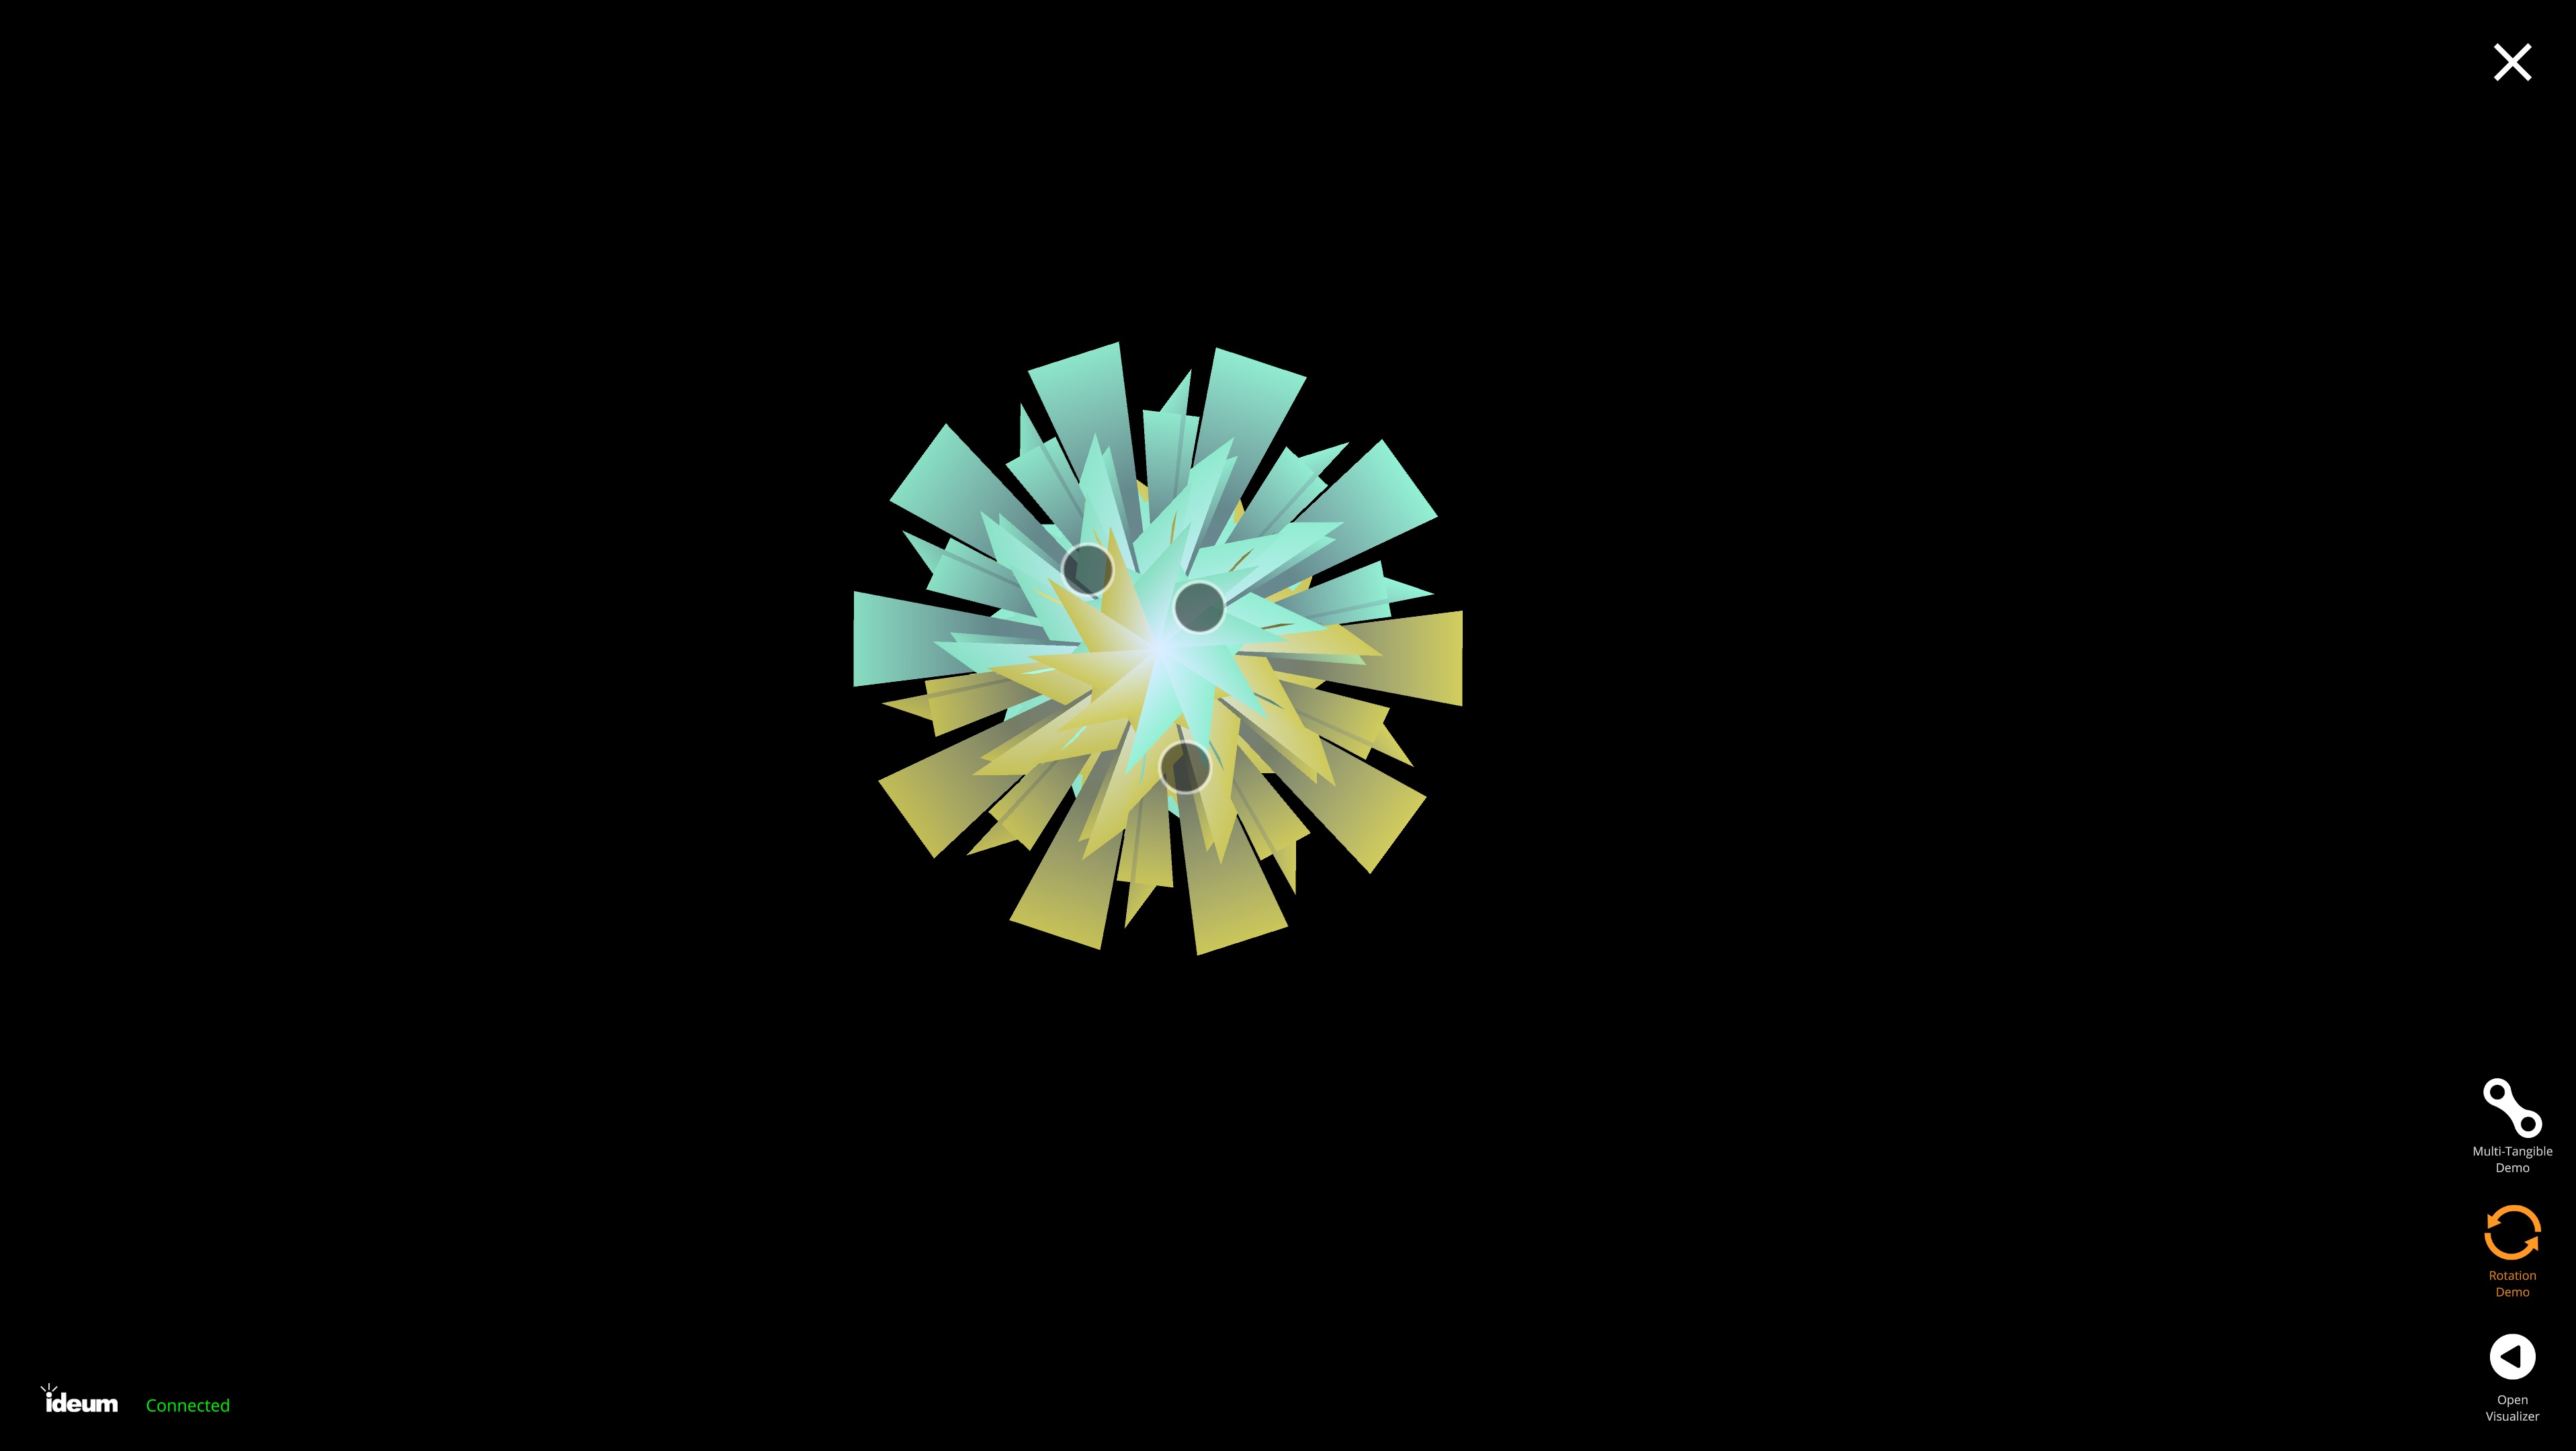
Demo Mode
The demo mode contains a few examples of how tangible recognition can be used with each example highlighting one aspect of the recognition software. For example, the rotation demo creates beautiful and elaborate kaleidoscopes that expand and morph as a tangible is rotated on the table, while the tangible interaction demo shows how tangibles can change the state of an application as they approach each other on a dynamic board.